In the transition from Universal Analytics (UA) to Google Analytics 4 (GA4), one of the features that many users miss is the Content Drilldown report.
This report in UA allowed users to view engagement metrics for page path levels, drilling down from directories into subdirectories and individual pages.
While GA4 doesn’t have a direct equivalent of this report, there are ways to access similar data.
Let’s explore how you can replicate this functionality in GA4.
Here’s what we’ll cover in this guide:
- Understanding the Change
- Method 1: GA4 Pages and Screens Report
- Method 2: Adding a Filter
- Method 3: Create an Exploration Report
- Method 4: Create a Drilldown report using Looker Studio
Let’s dive in!
Understanding the Change
In UA, the Content Drilldown report was a straightforward way to analyze content performance based on directory structure.
It was particularly useful for identifying popular topics or categories, refreshing content, and uncovering low-visibility content.
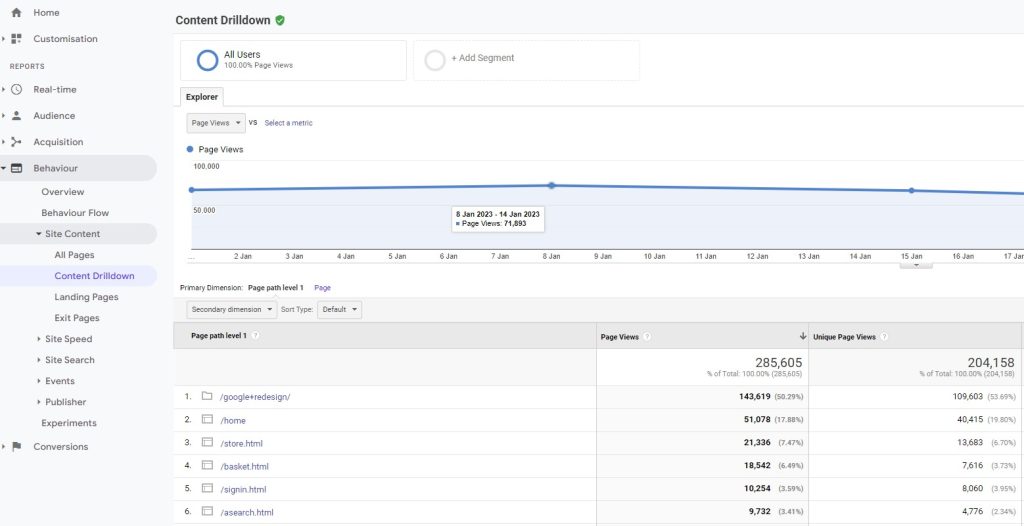
GA4, being a work in progress, currently lacks this feature.
However, with some creativity, you can still gather similar insights.
Method 1: GA4 Pages and Screens Report
If your website’s URLs are organized into directories and subdirectories, you can use the search tool in GA4’s standard reports to filter data based on URL segments.
To see the pages and screens report go to Reports → Engagement → Pages and screens.
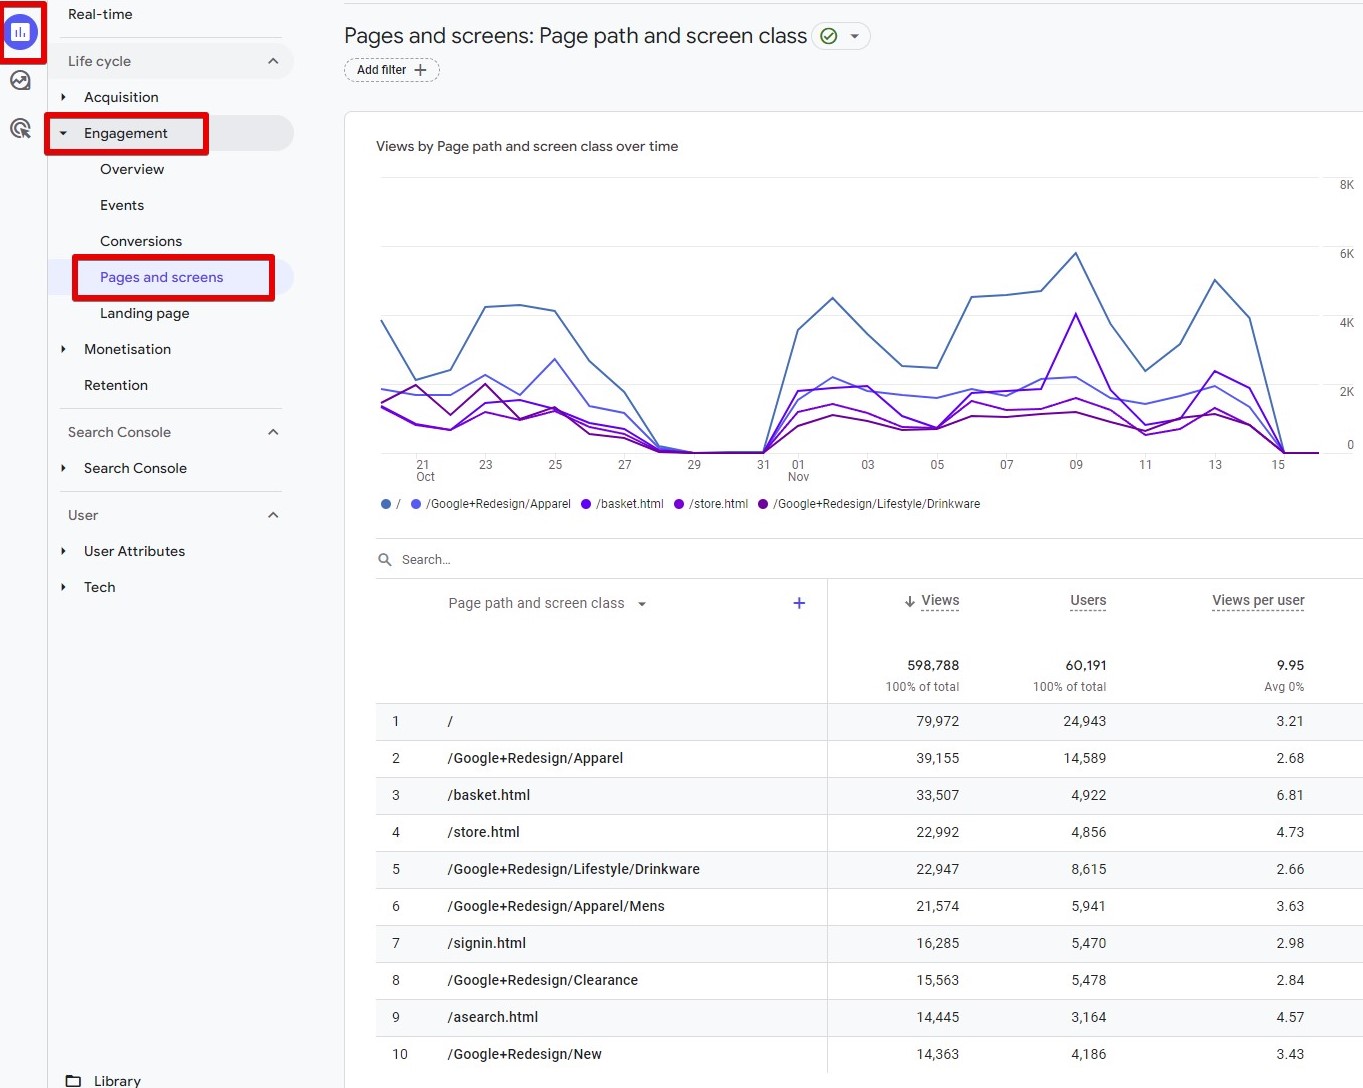
If you want to see only your blog posts for example and you’re using subdirectory /blog/, you’d enter the relevant URL in the search and it will only show you your blog posts.
This method is quick and easy, allowing the viewing of total and individual page metrics simultaneously.
However, you cannot view totals for different folders simultaneously, it requires manual input each time.
Also, this method lacks the good old customizable chart with a timeline which could allow you to have a nice overview of how your posts/pages are doing over time.
This feature is especially useful if you want to find anomalies or see which posts are losing traffic.
Method 2: Adding a Filter
You can use the filter feature to help you with finding specific posts/groups.
This feature will (unlike the previous method) change the time series chart.
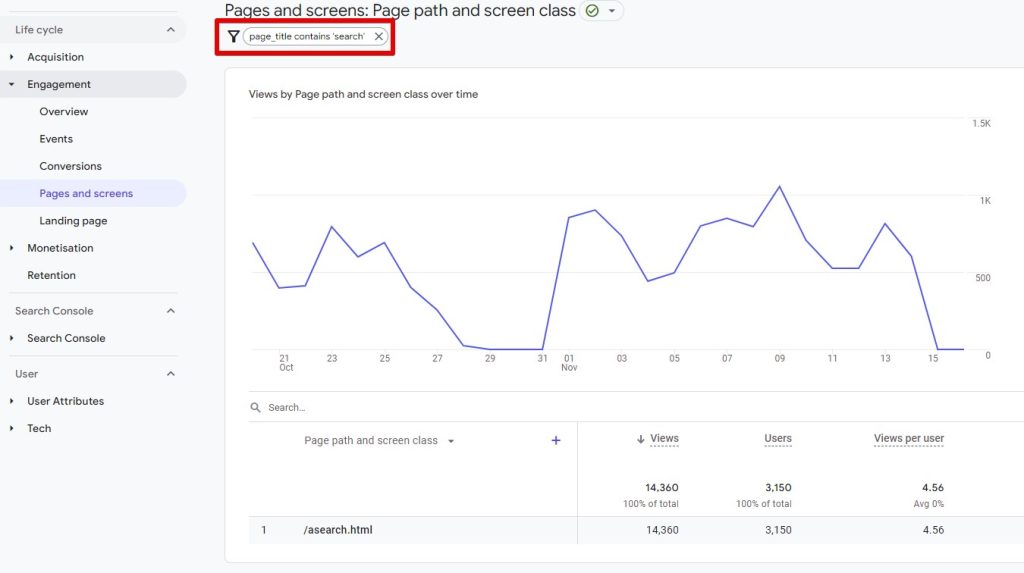
This feature is good, but time-consuming as you’d need to do this
Method 3: Create an Exploration Report
Moving on to the 3rd method.
This is a good method if you’re a fan of line charts.
Here’s an example of our exploration report for our posts.
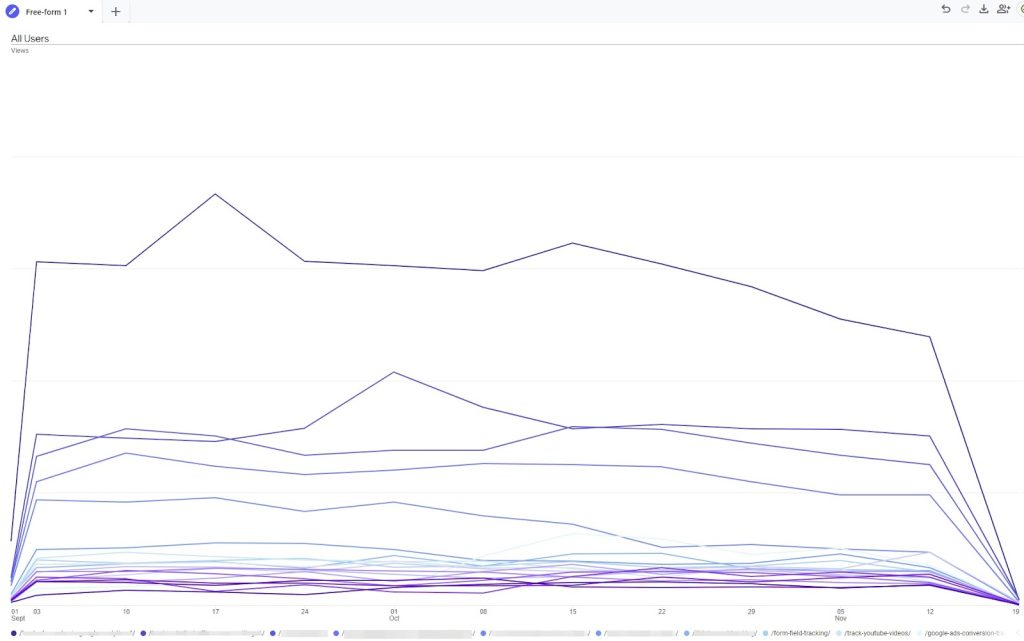
It doesn’t have to include all pages and screens, you can use filters here as well to dive into specific pages/posts.
Exploration report in GA4 offers flexibility in drilling down into content performance.
What’s good about the exploration report is the customization.
However, the problem with it is that if you want to search individual posts, this approach can be quite time-consuming.
The time it takes to load each time you change settings can prove to be inefficient.
To create this exploration report, go to Explore → Create a new exploration.
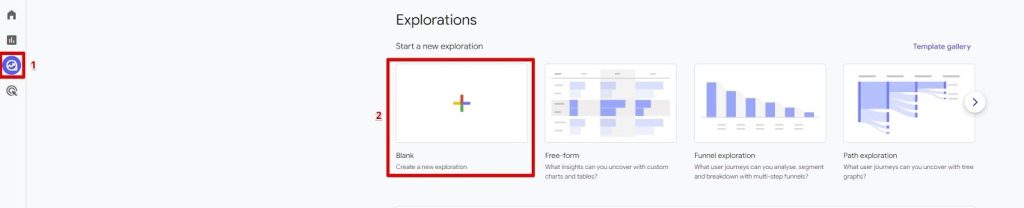
Below you’ll see our setting for replicating the drilldown report.
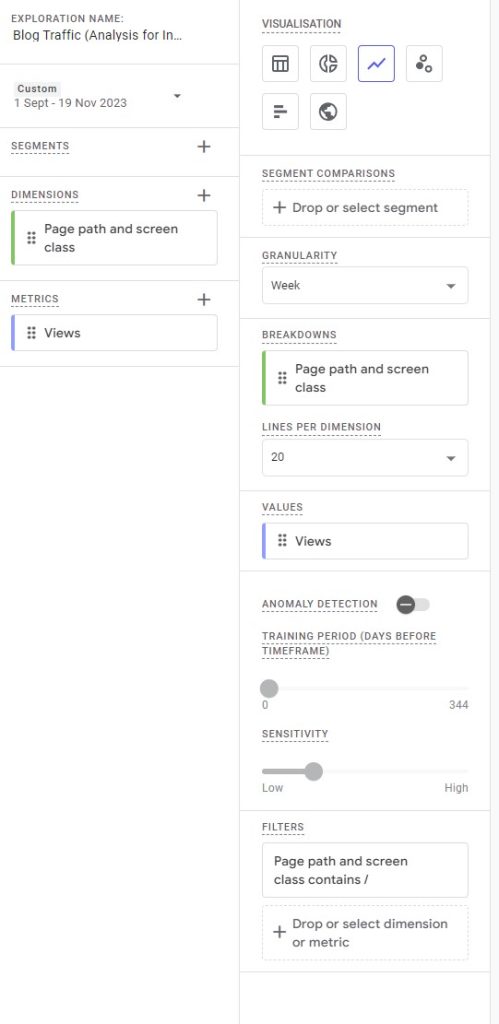
You can modify these settings to your liking.
Filters can be used in the same way as they were used in the previous method.
If you’re eager to learn more about other exploration reports, we suggest starting with the funnel exploration report.
Method 4: Create a Drilldown report using Looker Studio
This is a bonus one, we created as we were huge fans of the UA drilldown report ourselves.
Looker Studio can prove quite useful for creating charts and reports.
Below you’ll find how our report looks.
If you want to get this report, you can get a copy here, you’ll just need to connect your GA4 data to the report.
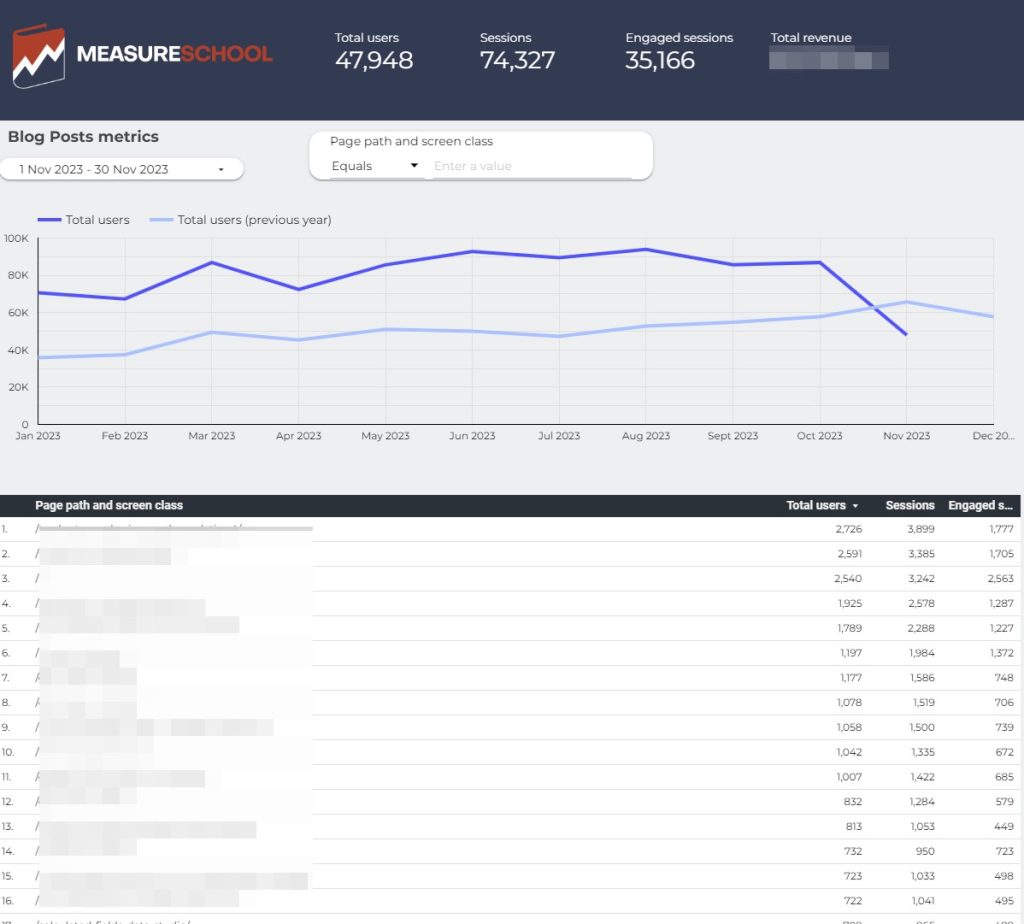
This is a great one if you want to look at your overall website performance, but also good for individual posts’ month-by-month line chart view, which we find extremely useful.
It’s a combination of both reports from the previous methods, you can get the numbers for the posts and pages as well as search for individual posts and see how they were doing over the last 2 years.
Summary
While GA4 doesn’t offer a direct Content Drilldown report like UA, these methods provide alternative ways to analyze content performance based on your site’s directory structure.
Each method has its pros and cons, so choose the one that best fits your needs and technical comfort level. As GA4 continues to evolve, we may see more direct solutions in the future.
For now, these workarounds can help you gain the insights you need.
This tutorial was provided by Julian Juenemann. Julian started and grew venture-backed startups with his unique ‘data first’ approach to Online Marketing. He then founded MeasureSchool.com to help marketers like him, with the data-driven way of digital marketing.