Last Updated on 4 years by School4Seo Team
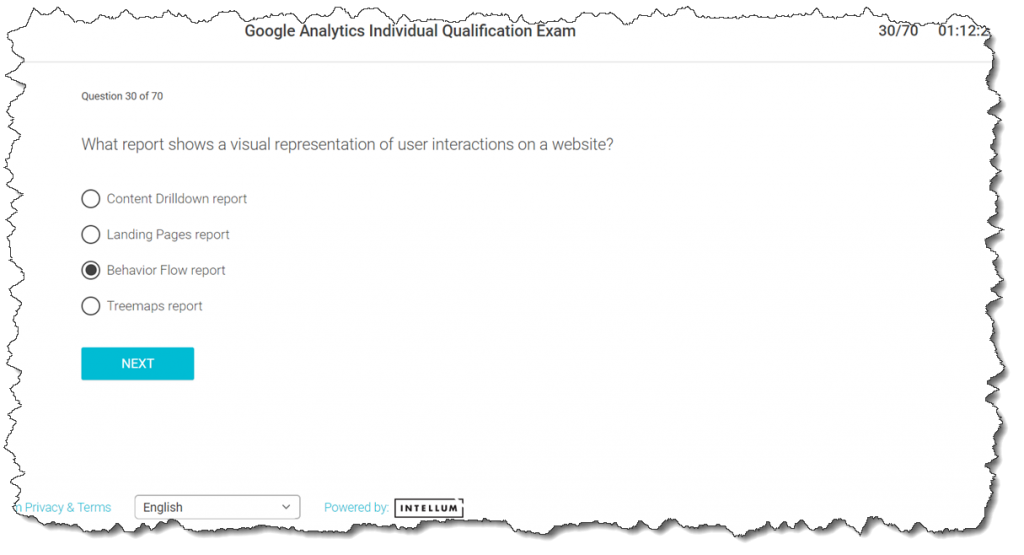
Behavior Flow report shows a visual representation of user interactions on a website.

- Content Drilldown report
- Landing Pages report
- Treemaps report
- Behavior Flow report
The correct answer is: Behavior Flow report
Explanation: The Behavior Flow report visualizes the path users traveled from one page or Event to the next. This report can help you discover what content keeps users engaged with your site.
Read more here: https://support.google.com/analytics/answer/2785577